Topics across time: temporal knowledge discovery in urban planning feedback data through machine learning

Design and Planning Lab, Urban Redevelopment Authority of Singapore

High-quality dialogue between the government and the public is a necessary component of the urban planning process. Data from public surveys, online feedback portals, and social media platforms are standard sources of public opinion on current issues and developments. However, deriving area or issue-specific insights from unstructured text requires planners to read individual messages – a tedious and siloed process that prevents planners from learning across related issues and cases.

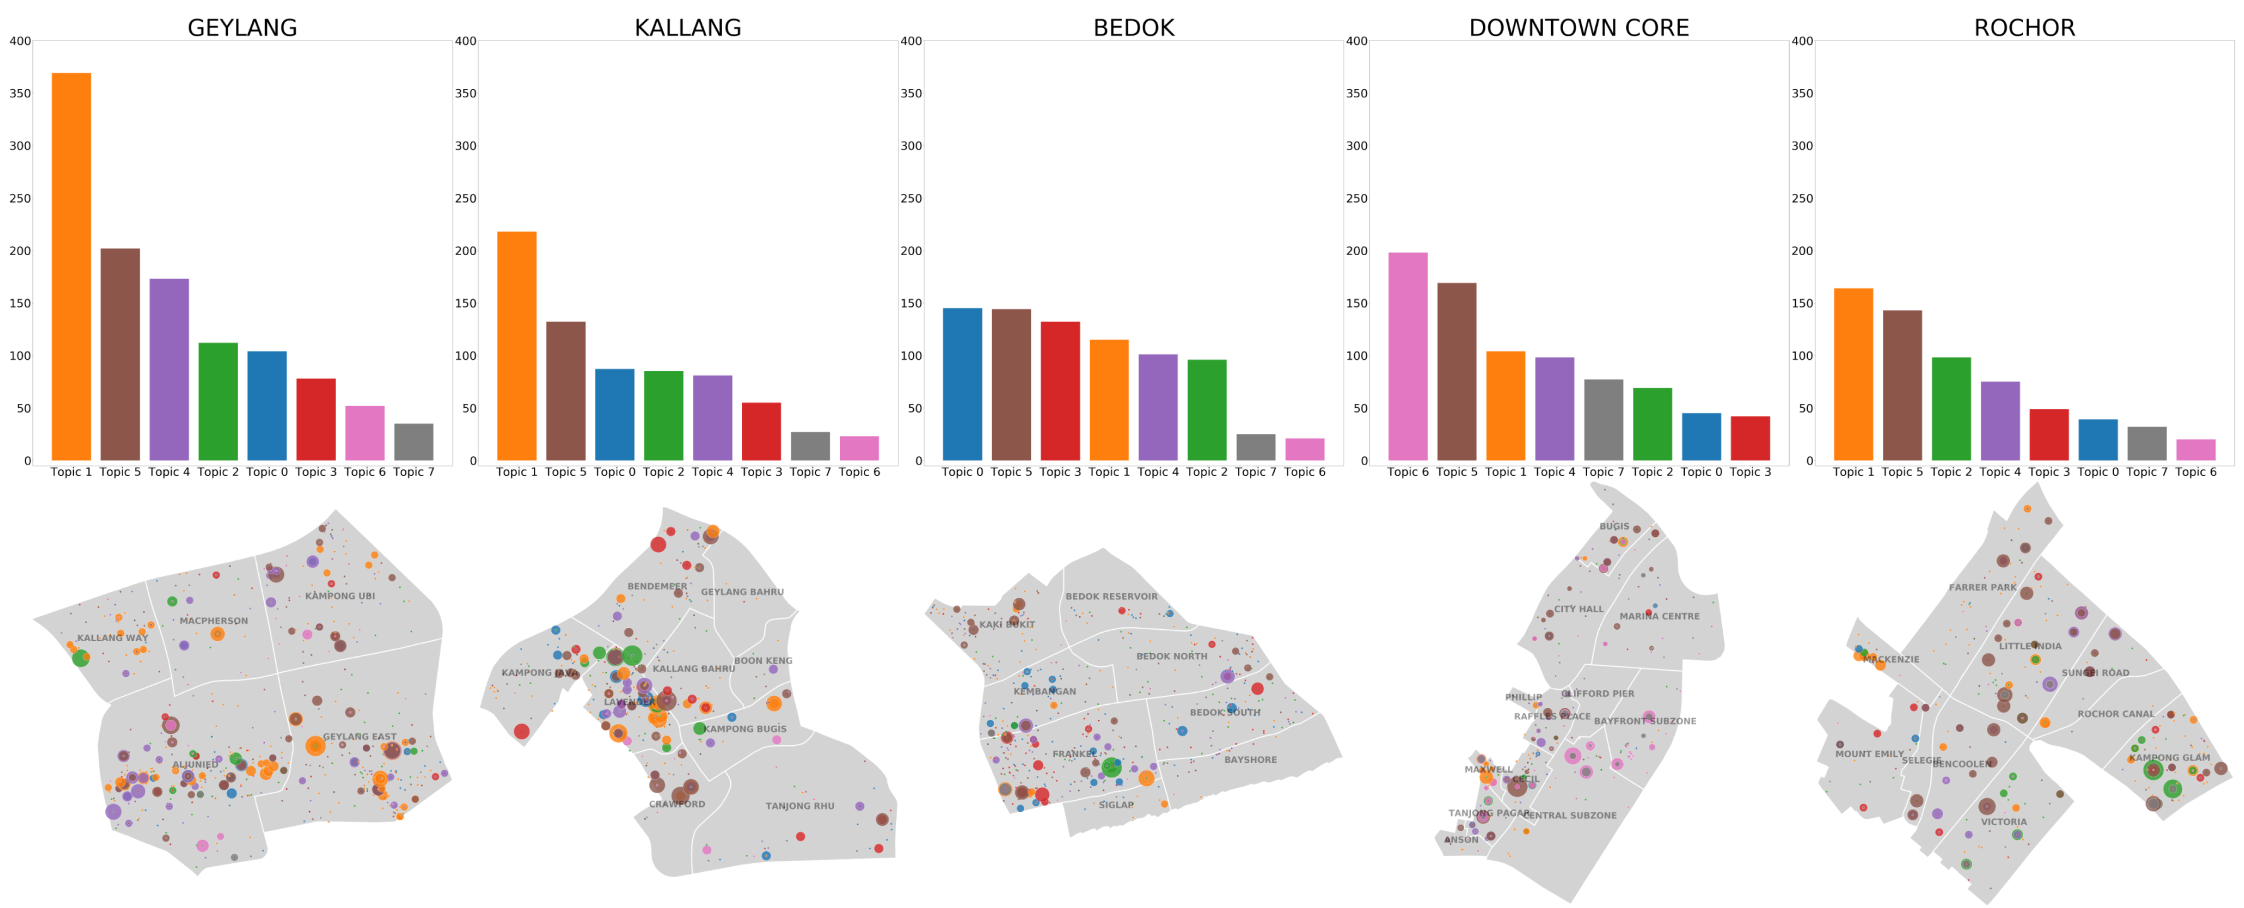
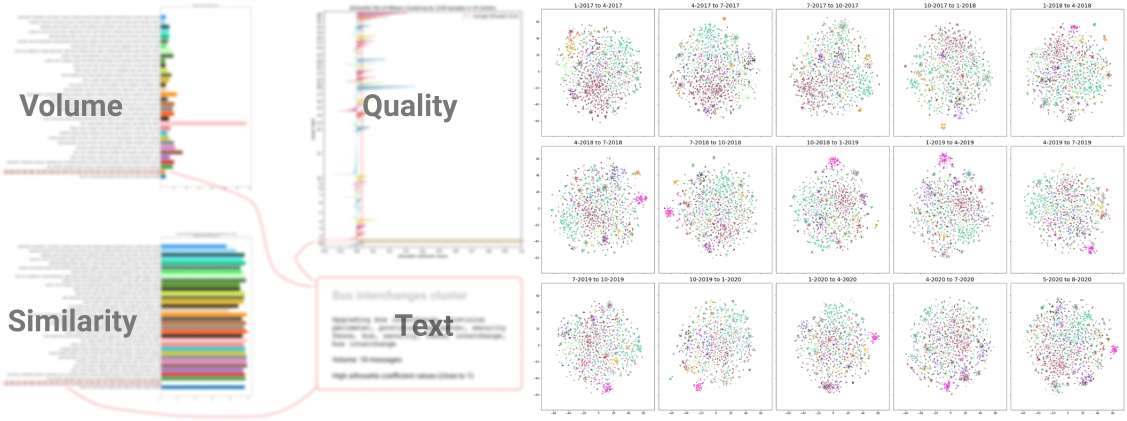
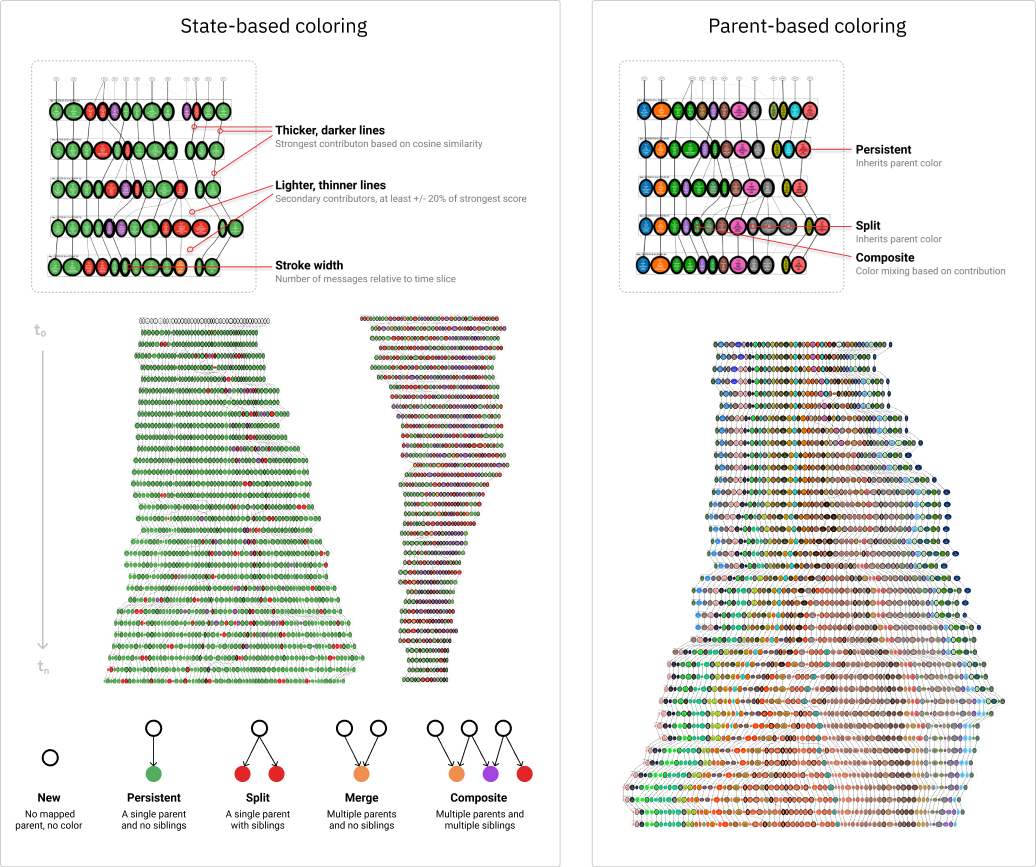
In this project, we interviewed planners to understand the structure of planning departments at URA, their workflows and how they currently use citizen feedback in their day-to-day decision making. Aside from coordinating expectations, meetings and deliverables with the DPL team, I developed a workflow to process unstructured text using natural language processing and machine learning into clusters or ‘topics’, with an emphasis on identifying and assessing the quality of persistent ('evergreen') and 'emergent' topics across time. I explored different metrics for assessing cluster quality and the similarity of clusters to one another temporally, based on the shared occurence of key words. These are reflected in the data visualizations on the next two pages, which were primarily designed by Nazim Ibrahim and involved my input. Both the workflow and data visualizations are currently in the process of being integrated into the ePlanner, an allin- one system of planning knowledge where datasets can be layered onto each other or consulted in detail by planners.

This project served as a precursor to another project on machine-assisted reply generation for urban planning queries. It will be part of the to-be-launched SUTD-URA Centre of Excellence.

2019-2021
Research
Data Visualization
Bianchi Dy, Nazim Ibrahim, Sam Joyce
B Dy, I Nazim, S Koh, A Chua, “Topics Through Time: Clustering and Visualizing Unstructured Public Feedback for City Planning” under review in Computers, Environment and Urban Society, 2022
Small multiples of each planning area, broken down into
    subzones. The bar chart in the top row shows topic volumes, while the bottom row shows 
    where messages are concentrated within the planning area.

I initially explored geospatial representations of the data such as choropleths and dot plots. Messages were clustered using k-means and TF-IDF after stop word removal. This project was the first time the data had been visualised on a map, and this feature was later brought over into URA's planning support system.

Left chart shows four blurred out graphs overlaid by the words
    Volume, Quality, Similarity and Text. The RHS shows a series of scatterplots containing t-SNE results.

I experimented with data visualizations such as bar charts, area charts (for cluster metrics) and t-SNE to represent clusters in the dataset. From interviews with planners, we learned that they were most interested in volume of the cluster, keywords inside the cluster, cluster quality and similarity to other clusters within or from other time slices. While t-SNE (RHS) showed both cluster volume, quality and similarity to other clusters, planners found it difficult to interpret, especially when making temporal comparisons.

Charts of temporal cluster tree. Left side shows state-based coloring
    and right side shows parent-based coloring.

To show all four aspects planners were interested in, Nazim and I developed the temporal cluster tree. It uses a shared documents score and cosine similarity to map relationships between clusters from different time slices. The two coloring systems enable users to identify lineages of topics, i.e. persistent or "evergreen" concerns and emergent topics.